
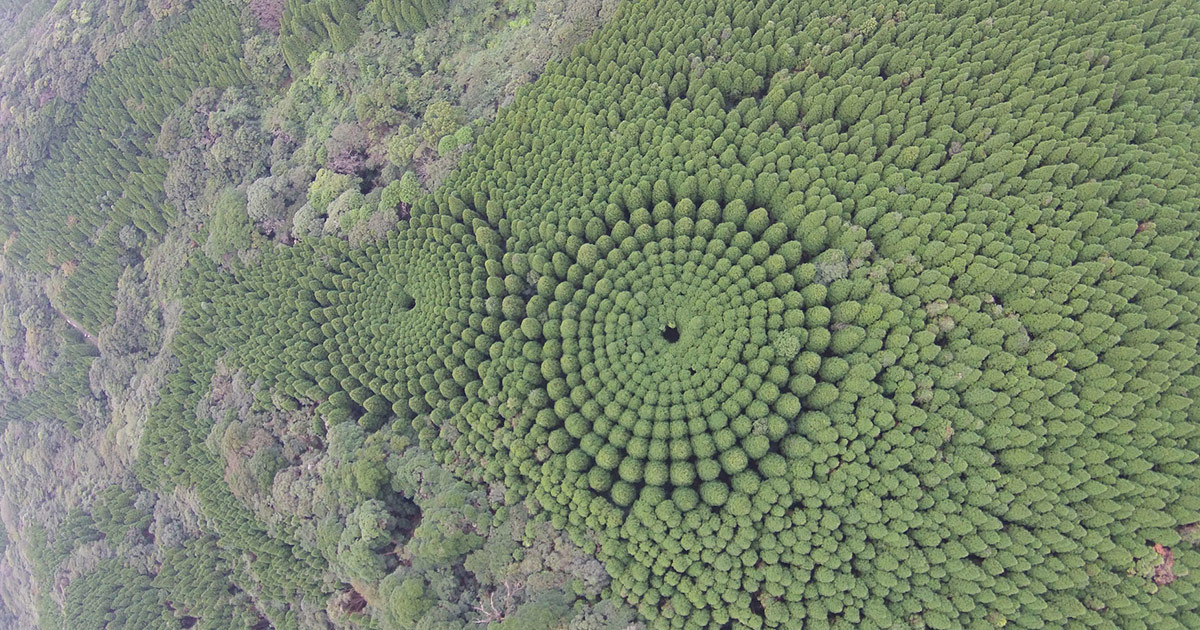
From above, two circular tree plantings in Miyazaki, Japan, look almost like ripples frozen into the landscape. Their geometry is so clear that the trees can seem like pieces of a giant drawing.
The explanation is wonderfully practical. These circles were planted for a forestry experiment, using an orderly design to investigate what happens when trees grow with different amounts of space around them.
A field experiment with a distinctive shape
A 2017 Japanese Forestry Agency account traces the planting to fiscal 1973. It describes Obisugi, a locally important form of Japanese cedar, arranged in ten concentric circles, with 36 trees on each ring.
The positions follow ten-degree intervals around the circles. As the rings widen, the growing space associated with the trees changes, creating a range of planting densities within a compact experimental layout.
This was deliberate geometry from the beginning. Later aerial photographs made the design famous, but the camera revealed an existing research arrangement rather than a newly formed mystery. (Update, October 2026: A Kyushu Regional Forest Office fact sheet describes two circular density-trial plots of 0.225 hectares each; in fiscal 2020 the stands were 47 years old and had never been thinned, and the trial was set to run for 50 years, to fiscal 2023 (Source).)
The plantings are near Nichinan City in Miyazaki Prefecture. In the aerial views, the canopy dips toward the center, giving the circles a shallow, concave profile as well as a striking plan-view pattern. The Forestry Agency’s account of the experiment provides the planting layout and location. The visible shape is worth describing, while the effect of density on individual trees requires the experiment’s measurements.
Why spacing is a useful question
The agency places the experiment in the context of changing timber requirements, including the shift from widely spaced trees grown for shipbuilding towards timber for buildings.
Imagine giving the same number of seedlings two very different plots: one generous, one crowded. The question immediately becomes more interesting than which group looks greener. How do the trees divide the available growing space? What happens to their form? Which measurements would matter to the people eventually using the wood?
A research planting lets those questions be followed over time. The striking circular outline is the arrangement that helps organise the comparison.
An aerial photograph shows only part of the result
The canopy pattern is easy to appreciate, but a photograph alone does not provide a complete growth record. It cannot tell us every tree’s diameter, wood properties or survival history.
Nor does a density experiment identify one perfect spacing for every forest. A useful conclusion has to stay connected to the trees, place, objectives and measurements involved.
The same distinction appears in research that counts trees in dry landscapes: seeing a pattern from above can reveal something valuable, while understanding its meaning still requires careful definitions and ground-level knowledge.
Enjoy the pattern and the patience behind it
These circles offer an unusually visible example of long-term research. The design was set out by people whose results would continue growing for decades.
They also belong beside more recent discoveries made with aerial methods, such as the mapped settlements of the ancient Casarabe culture. In one case we are seeing a planned forestry trial; in the other, traces of a much older landscape. Both become more rewarding when we learn what produced the shapes.
More images


Google Earth
The geometry makes density visible
Japan’s Forestry Agency describes a trial with 36 trees at each of ten concentric positions, set at ten-degree intervals. Its historical account gives planting densities ranging from 377 to 10,027 trees per hectare. Those are different experimental densities, not a single spacing prescription for every forest. The agency’s November 2017 account documents the design.
Here is a simplified geometry example, separate from the actual site measurements. Place 36 points evenly around a circle with a radius of three meters. Place another 36 around a circle with a radius of six meters. Because circumference is proportional to radius, the distance measured along the second circle between neighboring points is twice as large. The repeated number of positions can therefore coexist with very different spacing.
Aerial beauty and experimental evidence
The overhead view makes the arrangement immediately legible. It does not, on its own, measure timber quality, tree volume, or the causes of every difference in the crowns. Those questions require observations of the trees and knowledge of the trial.
This is the pleasure of the image: what first resembles decorative landscape art also records a practical question about how closely trees should grow together. Looking for the repeated positions and changing gaps reveals the experimental idea without having to mistake a striking photograph for the complete research result.
For a different long-running plant story, explore David Latimer's Bottle Garden: An Archive Story.
Original reporting, credits and background: Location map linked in the original feature · Spoon & Tamago.


COMMENTS