
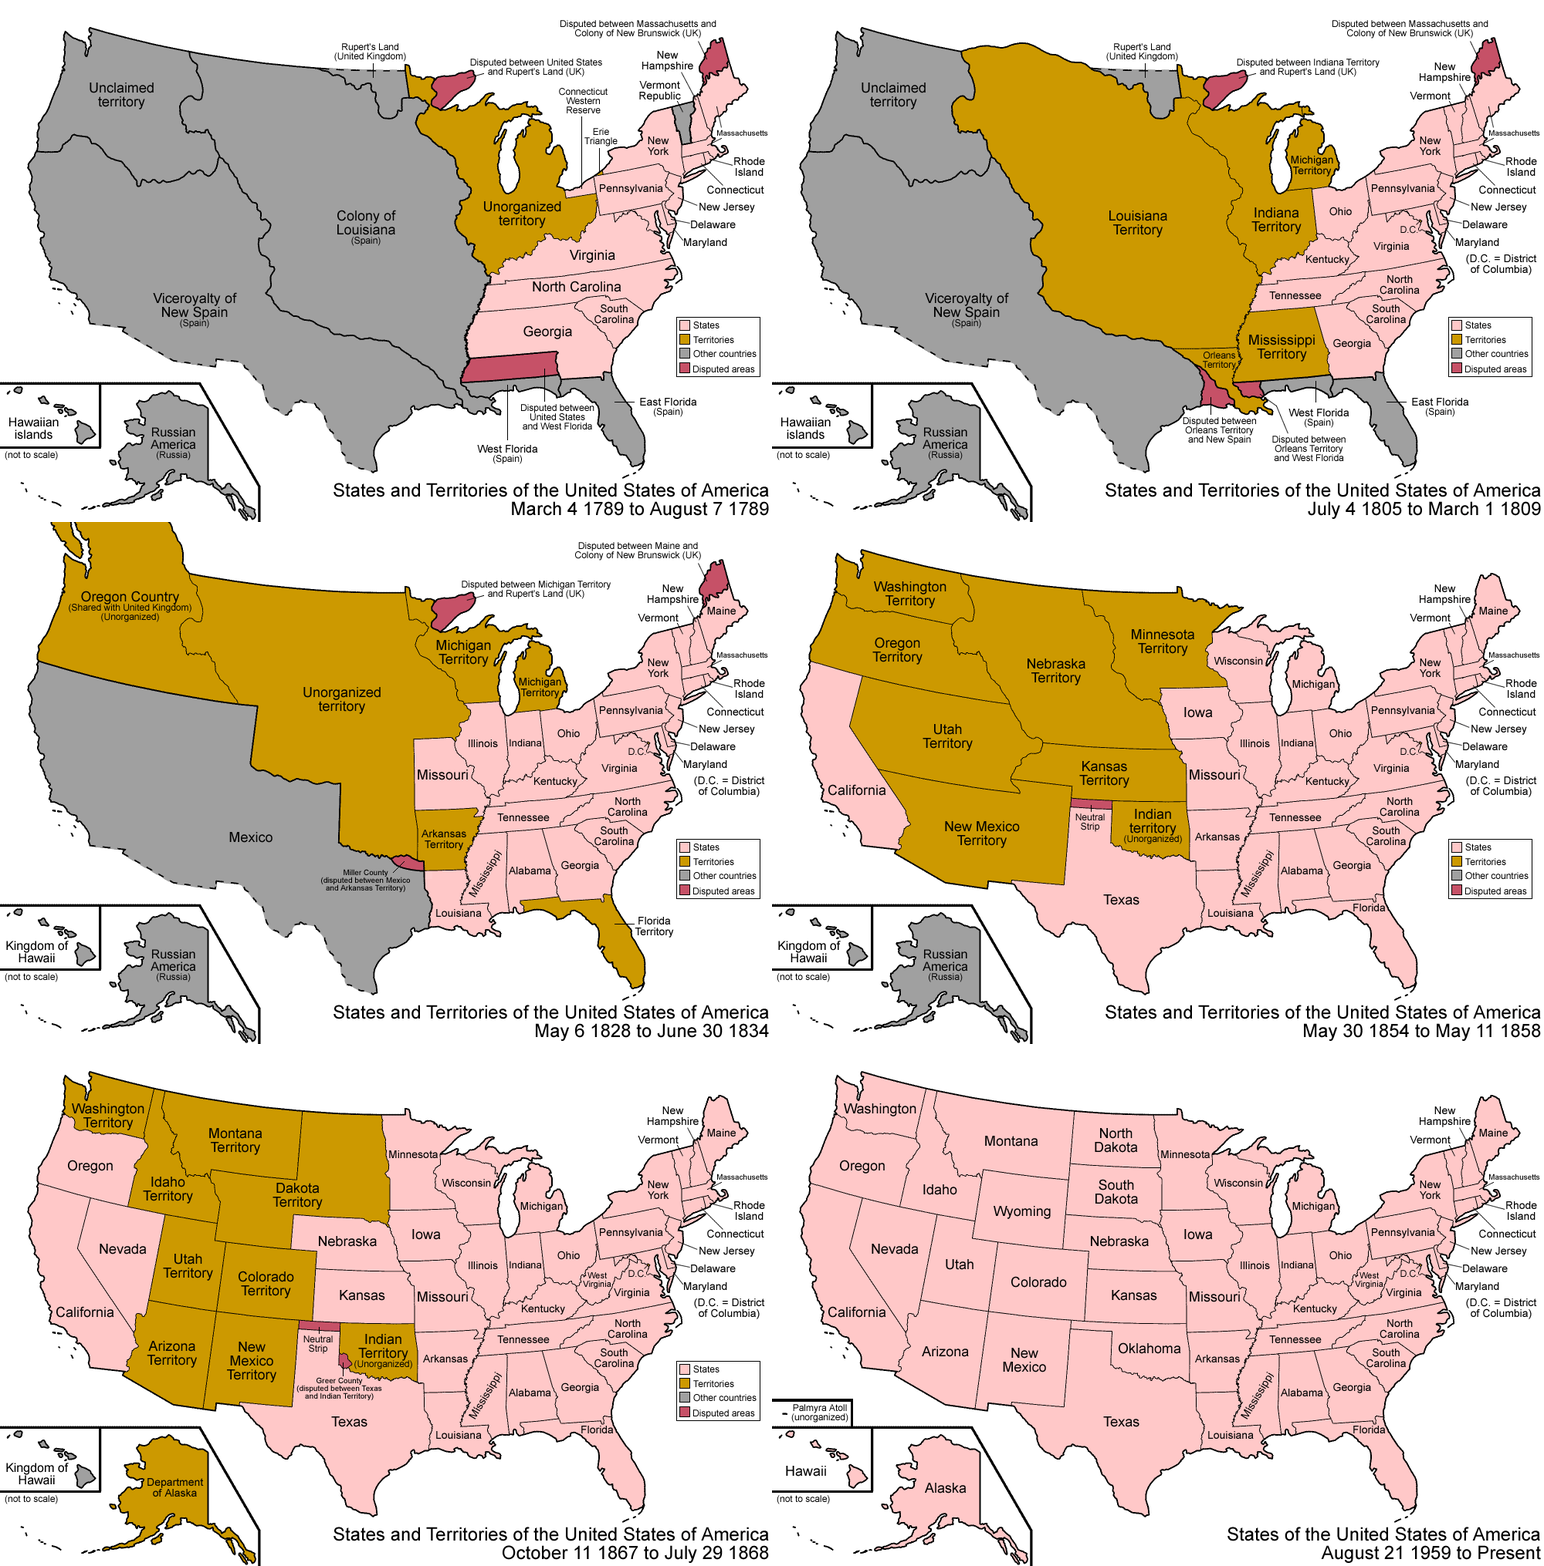
The animated map below shows how the borders of the United States changed from independence to the admission of the 50th state. In a few seconds, colonies become states, vast territories appear and are carved into smaller pieces, and lines that look permanent today shift again and again. It is one of the clearest ways to see that the country's shape was assembled over about 175 years, through treaties, purchases, wars and the forced removal of Native nations.

Click image to Zoom
The map tells the story from one angle: how land became organised territory and then statehood. Behind each moving line are people who lived there first, negotiations that took years, and conflicts that cost many lives. The guide below helps you read what you are seeing and what the animation leaves out.
The big expansions, in order
Most of the dramatic jumps in the animation correspond to a handful of events:
- 1783, Treaty of Paris. Britain recognised American independence, and the new country's land stretched west to the Mississippi River.
- 1787, the Northwest Territory. Land north of the Ohio River was organised as a federal territory, setting the pattern for turning territories into new states rather than enlarging the original thirteen.
- 1803, the Louisiana Purchase. The United States paid France $15 million for its claim to about 828,000 square miles west of the Mississippi, roughly doubling the country on paper.
- 1819 to 1821, Florida. The Adams–Onís Treaty with Spain, signed in 1819 and in force from 1821, transferred the Floridas and set a western boundary with Spanish lands.
- 1845, Texas. The independent Republic of Texas was annexed as the 28th state, a step that led directly to war with Mexico.
- 1846, Oregon. A treaty with Britain fixed the border in the Northwest at the 49th parallel.
- 1848, the Mexican Cession. After the Mexican–American War, the Treaty of Guadalupe Hidalgo transferred California and much of today's Southwest.
- 1853 to 1854, the Gadsden Purchase. A strip of southern Arizona and New Mexico was bought from Mexico, largely for a railway route.
- 1867, Alaska. Purchased from Russia for $7.2 million, about two cents an acre.
- 1898 and 1959, Hawaii. Annexed in 1898, five years after the overthrow of the Hawaiian monarchy, and admitted as the 50th state in 1959, a few months after Alaska.
Buying a claim is not buying the land
The map makes the Louisiana Purchase look like a simple transaction of empty space. It was not. France controlled only a small part of the area, and most of it was home to Native nations who were never consulted. What the United States actually acquired was the right, as against other European powers, to obtain that land from its inhabitants by treaty or by force. The later treaties, wars and removals cost far more, in money and in lives, than the $15 million paid to France.
The same is true across the continent. Under the Indian Removal Act, signed by President Andrew Jackson in 1830, more than 60,000 people from nations including the Cherokee, Chickasaw, Choctaw, Muscogee (Creek) and Seminole were forced west during the 1830s. Many died on the journeys remembered as the Trail of Tears. Most were resettled in Indian Territory, in what is now Oklahoma, which itself was later opened to settlers and merged into the state in 1907.
When you watch the map, the shrinking of Indian Territory is one of the quietest changes on screen and one of the most consequential in history.
The strip that belonged to no one
One of the oddest details in the animation is a narrow rectangle between Texas and Kansas that sits unattached for decades before joining Oklahoma around 1890. This was the Public Land Strip, better known as No Man's Land.
It was created by slavery politics. The Missouri Compromise barred slavery north of latitude 36°30'. When Texas joined as a slave state, its northern lands above that line were a problem, and under the Compromise of 1850 Texas gave them up. Kansas's southern border was fixed at the 37th parallel, and New Mexico Territory lay to the west. The strip in between, about 170 miles long, belonged to no state or territory.
For forty years it had no organised government and no surveyed land titles. Settlers who moved in during the 1880s formed vigilance committees and in 1887 even elected a legislature for a self-declared Cimarron Territory, which Congress never recognised. The Organic Act of 1890 finally attached the strip to Oklahoma Territory, and it became today's Oklahoma Panhandle. Getting mail, deeds or a judge there in the meantime was, as you might expect, difficult.
A neighbouring quirk, Greer County, was disputed between Texas and the federal government until a Supreme Court decision in 1896 gave it to Oklahoma Territory.
Why territories came before states
Much of the animation shows huge territories that are later sliced into states. This followed a model laid out in the 1780s: Congress organised a territory with an appointed government, and once its population grew large enough, residents could write a constitution and apply for admission on equal terms with existing states.
Where lines were drawn often reflected politics as much as geography. In the decades before the Civil War, the admission of each new state was tied to the balance between slave and free states in the Senate, which is why compromises in 1820, 1850 and 1854 reshaped so many borders. West Virginia's split from Virginia in 1863, during the Civil War, is another change you can spot in the map.
What borders that move can teach us
The animation is a useful corrective to the idea that national borders are fixed and natural. The United States as most people picture it took shape only in 1959, and the country still has territories such as Puerto Rico and Guam whose residents are citizens without full representation in Congress.
That does not settle modern debates about immigration or borders, but it adds context. The people who lived in Texas, California or New Mexico in 1848 did not cross a border; the border crossed them. Hawaiians in 1898 and Native nations throughout the nineteenth century experienced American expansion as something done to them, not something they joined.
A good way to use the map is to pause on any frame and ask three questions: who lived here, who claimed it, and who decided?
Where to explore further
Wikipedia's article on the territorial evolution of the United States includes year-by-year maps and a detailed timeline of every change, from small boundary adjustments to major cessions. Tribal nations' own histories, many published by the nations themselves, give the perspective a boundary map cannot.
Sources: Wikipedia: Territorial evolution of the United States; Wikipedia: Louisiana Purchase; Wikipedia: Indian Removal Act; Wikipedia: Oklahoma Panhandle; Wikipedia: Alaska Purchase; animation as shared by Upworthy.
Related:- Stunning Time Lapse Map Video Shows 1000 Years Of Europe's History In 3 Minutes
- This is What Americans Will Look like by 2050 – and it’s Stunning
- The 63 Most Powerful Photos Ever Taken That Perfectly Capture The Human Experience.
- Twenty Archive Photographs and the Context Behind Their Captions
- These 20 Photos Are Going To Make You Cry. But You’ll See Why It’s Totally Worth It.
- 16 Children & Their Bedrooms From Around the World…
- Composite Faces Labelled by Country: What an Average Image Represents


COMMENTS